How well the offer on your landing page/squeeze page converts when targeting visitors from Facebook (or other similar display media such as banner ads) is not always just related to the quality and effectiveness of the offer and the design and copy on your landing page.
It’s very commonly understood in the direct response marketing world to test and measure different traffic sources to see how they convert. The school of thinking here is sound, because you can then ‘run your winners long and cut your losers short’ by keeping any traffic sources that are converting well and culling the traffic sources that are not converting to a standard that you are happy with.
But what about within traffic sources?
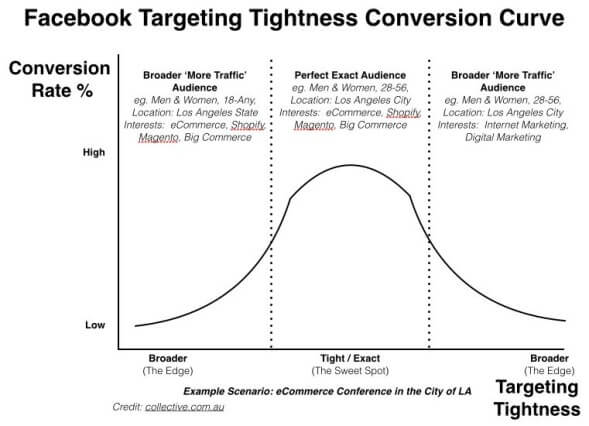
One thing that can affect your conversion rate in a major way is the ‘tightness’ of the traffic within a traffic source. This can be shown below with the ‘Facebook Targeting Tightness Conversion Curve’.
The Facebook Targeting Tightness Conversion Curve
What this shows is that within traffic sources the conversion rate will vary depending on the ‘tightness’ of the traffic, meaning the closer your targeting is to the exact audience who is your perfect avatar (the sweet spot), then the higher that the landing page is likely to convert because your ‘message to marketing match’ is more exact.
The further that you get away from the sweet spot of your exact target market into broader edge traffic that have similar characteristics and interests, then the lower the conversion rate as a general rule.
How this came about for us was we had a seminar landing page that was converting at roughly 10% from Facebook traffic, which is not great but given that events have time and location components it is understandable. We then decided that we ‘needed more traffic’ so instead of just targeting our ‘sweet spot’ traffic of 46,000 people in the city we were holding the event we decided that we would go broader. We then targeted 600,000 people that were ‘edge’ traffic for us that had similar characteristics and interests to our exact avatar.
Our conversion rate went down as low as 1%-2%. It sounds silly with the benefit of hindsight, but at this stage I hadn’t put two and two together and figured out what was causing the issue. So I setup a new split test and started testing ‘video’ vs ‘no video’ design to see if the video was the problem.
It was only when I was talking to my brother Dave the mechanic on the phone and he said to me ‘everyone I know keeps telling me that they are seeing you on facebook’ that I realised it wasn’t the page, the video or the offer, it was the targeting tightness that was the problem. Luckily I’d had a few nights out on the town with Dave’s mates to know that they were not our perfect target audience for a digital marketing event.
So that’s the story behind the Facebook Targeting Tightness Conversion Curve. It’s worth now taking a moment and thinking about your Facebook Ads and seeing how close are they to your ‘sweet spot’ or are you potentially wasting money like I was.
Let us know your thoughts or experiences on this.